The Trading Journal That
Builds Real Discipline.
A professional trading journal that turns every trade into a lesson. Track, analyze, and refine your edge — built for forex, crypto, and stock traders who treat trading like a business.
Ready to Build Real Edge?
Built for every part of your trading day
From the first plan of the day to your weekly review — one cockpit for the whole loop. Click a tab to take a look.
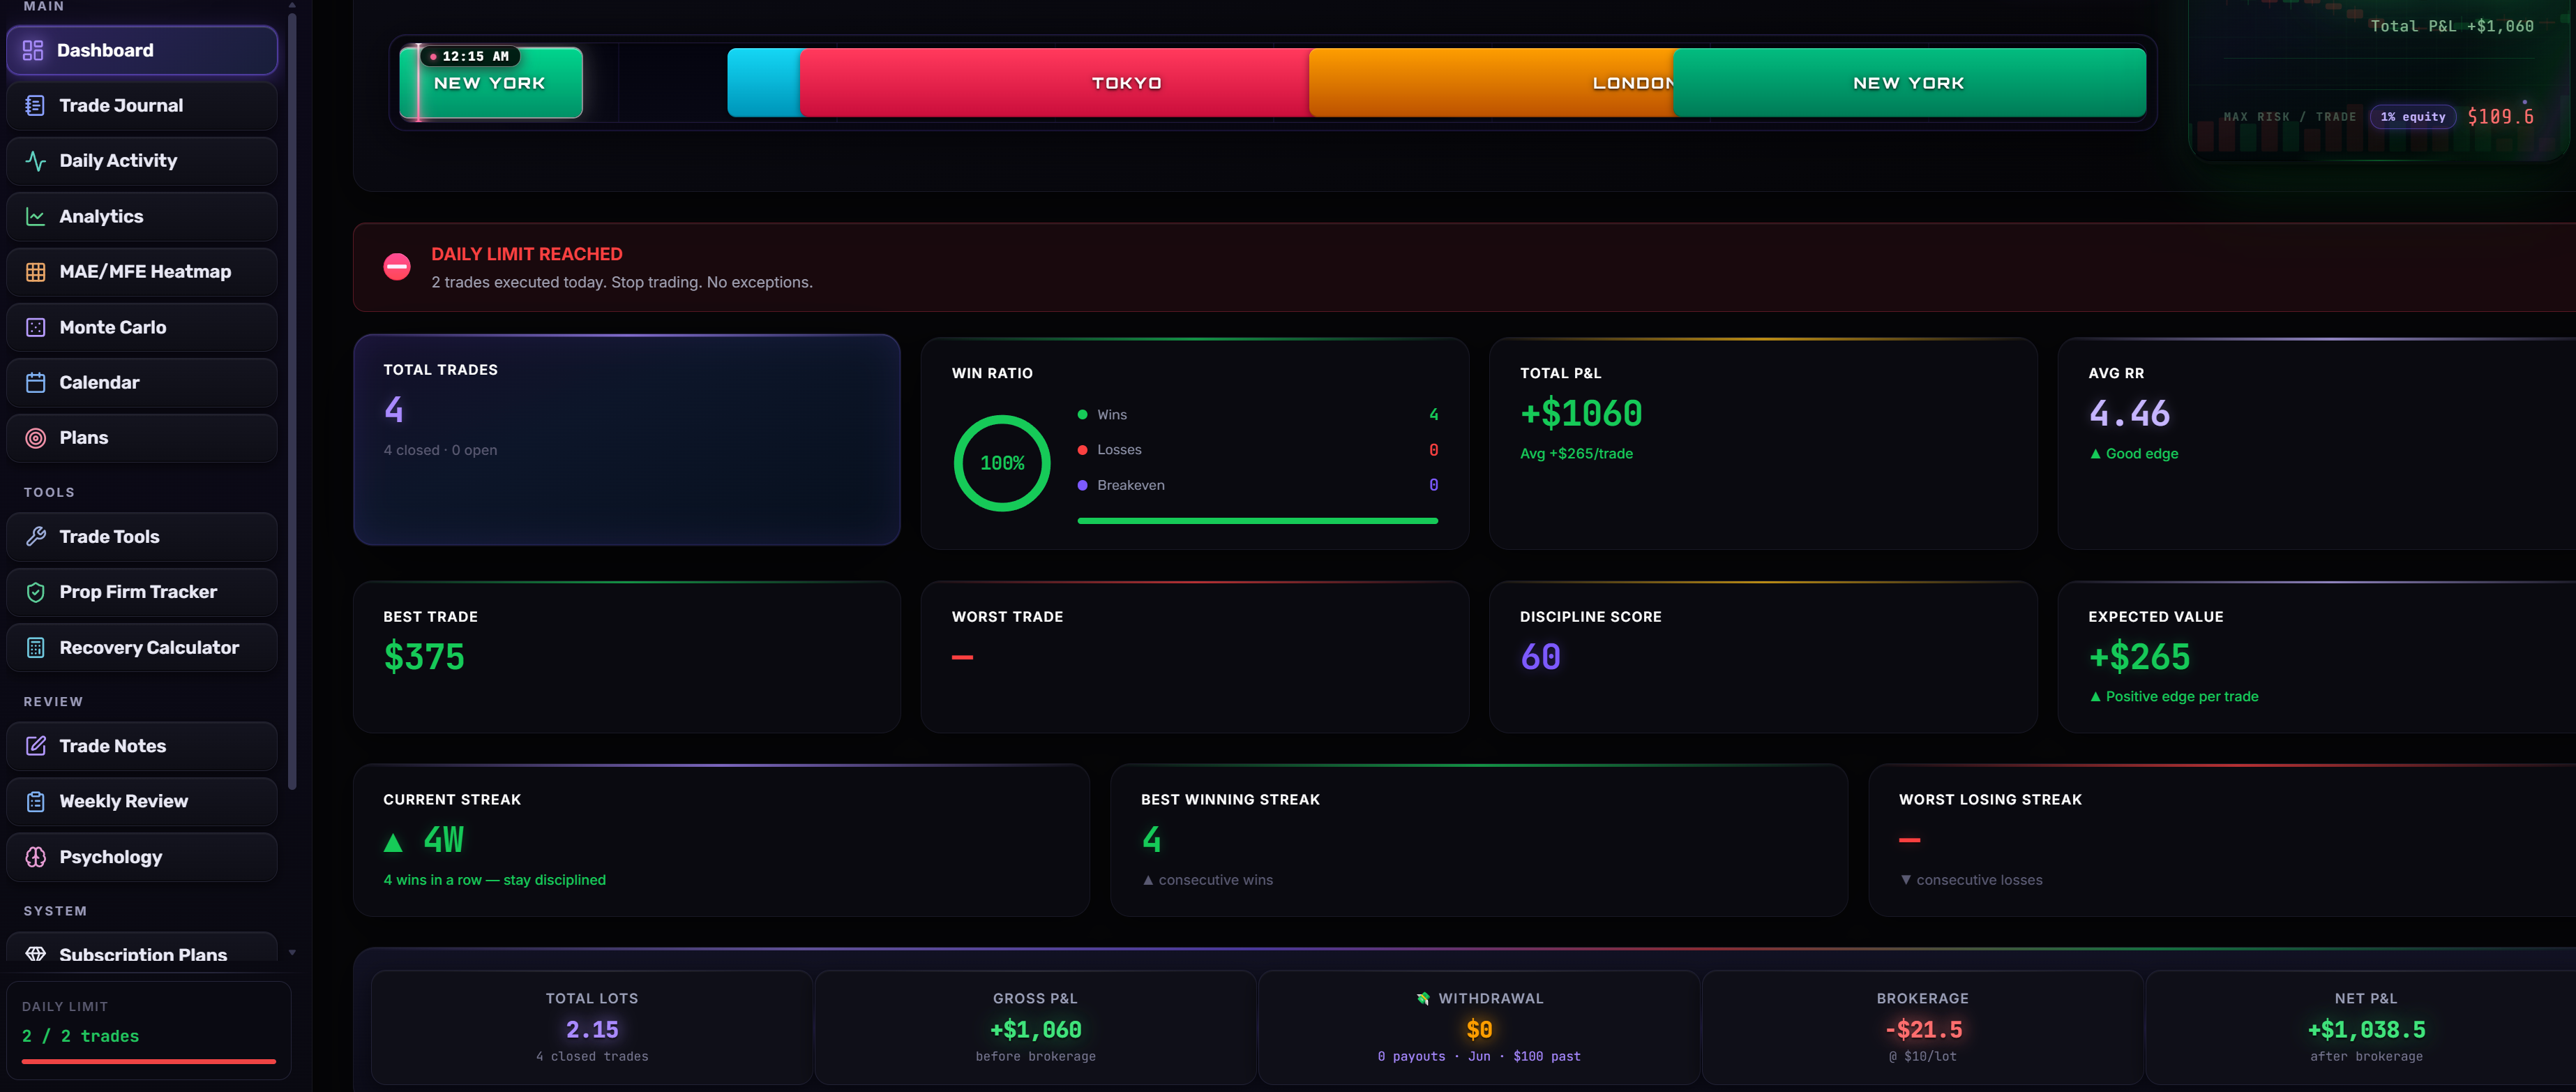
Your trading day, at a glance
Gross-to-net P&L after brokerage, lots traded, equity curve, daily trade limit and your to-do list — surfaced the moment you log in. Multiple workspaces, one cockpit.
- Net P&L after brokerage — the number that matters
- Daily trade limit meter (e.g. 0 / 2 trades) stops overtrading
- Daily checklist, announcements & economic calendar built in
- Multi-dashboard workspaces for every account you run
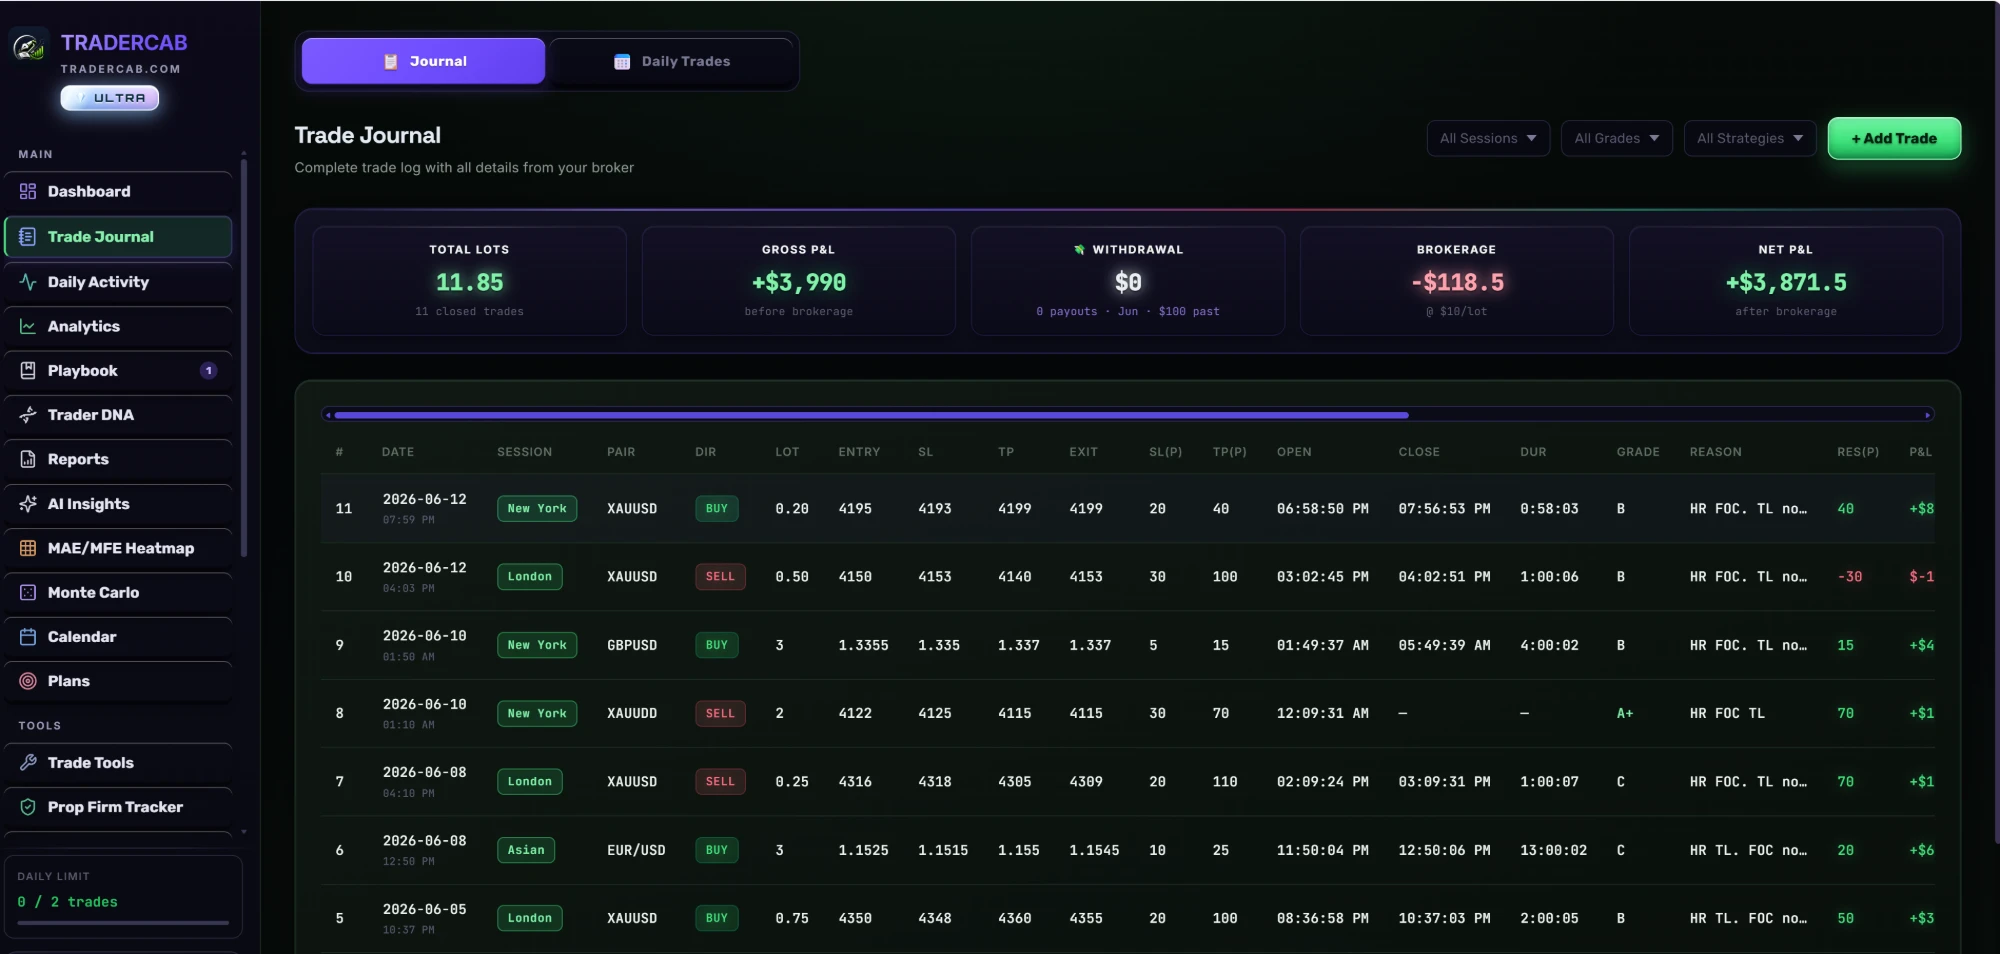
Every trade, logged & graded
Entries, exits, SL/TP with auto-calculated pips, R-multiples, sessions, mood before & after, screenshots — for live trades and a separate Backtest Journal.
- Auto-calculated R, pips & P&L from your prices
- Session, setup grade (A+ to D), mood & strategy tags
- Daily-limit guard on every entry — discipline enforced
- OTP-verified edits, MT5 auto-sync & CSV import
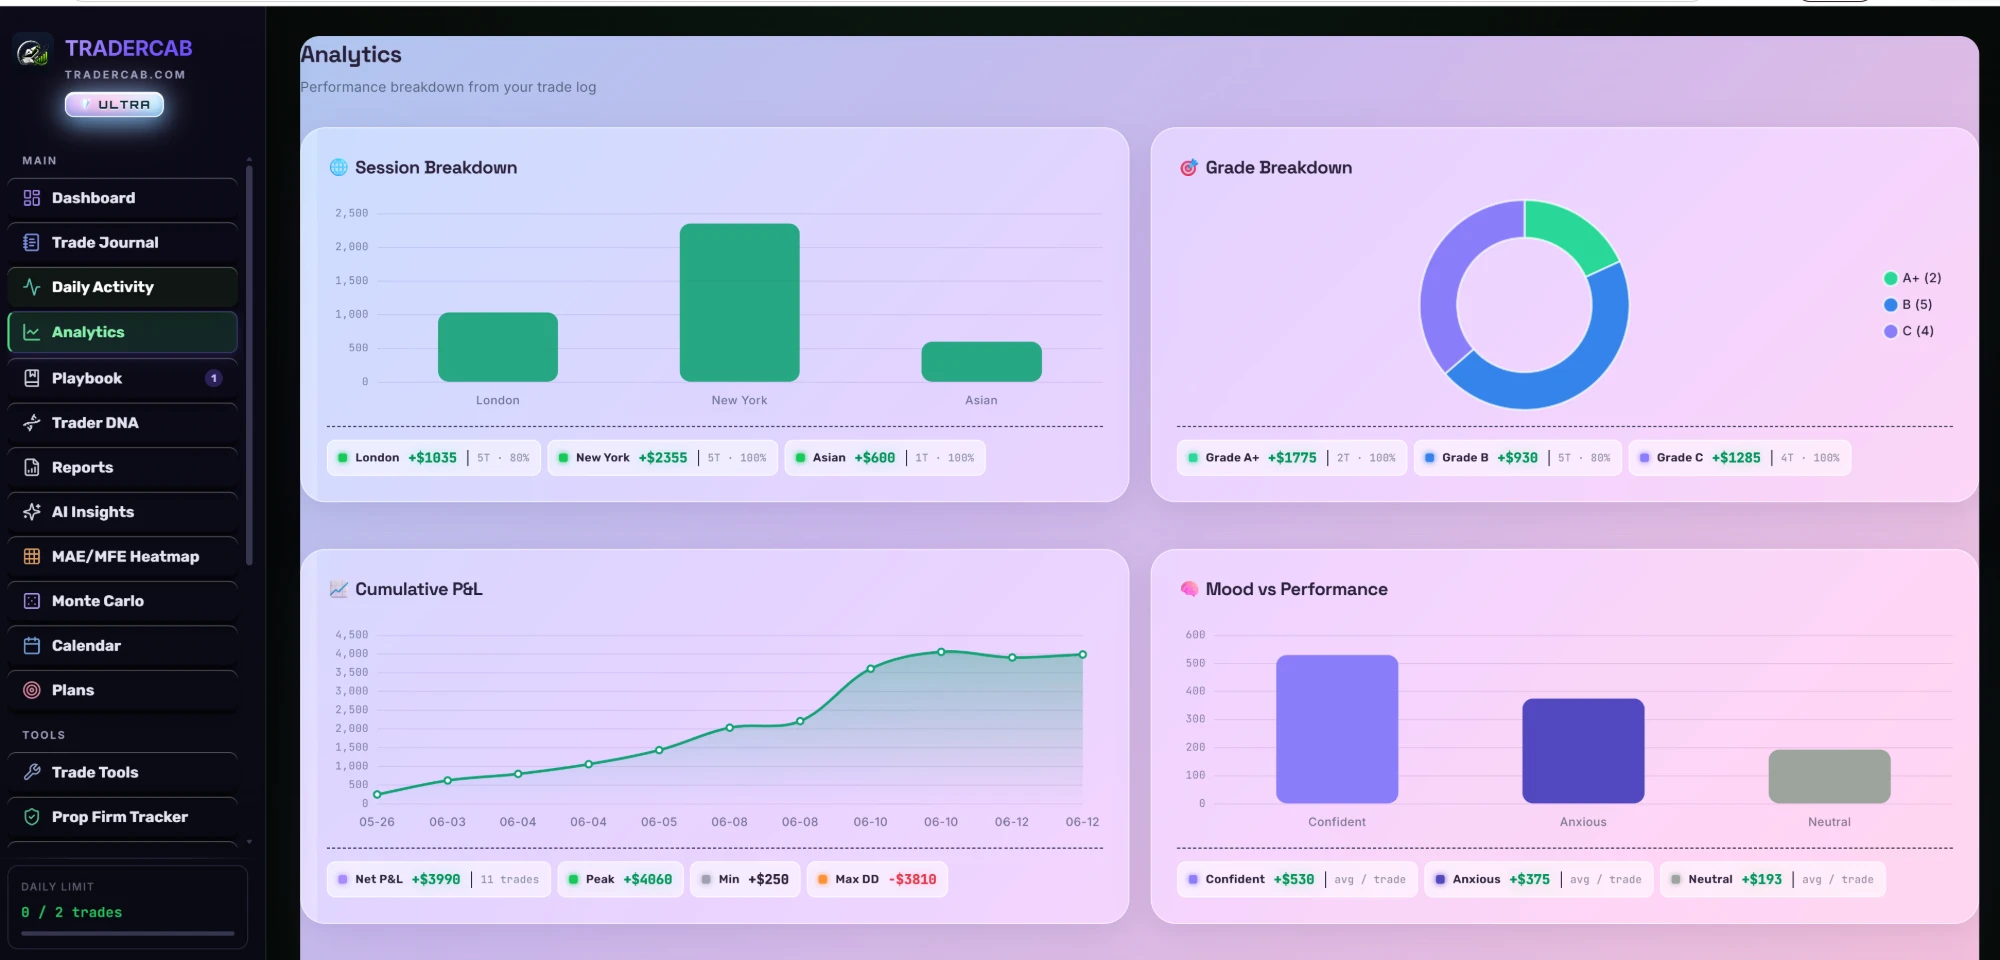
Find your real edge
Granular breakdowns by session, day, hour, symbol and R-multiple — plus MAE/MFE heatmaps and AI Insights that name your leaks in plain English.
- Win-rate & P&L by session, day and hour
- R-multiple distribution, expectancy & profit factor
- MAE / MFE heatmap — where your stops & targets really sit
- Trader DNA score, AI Insights & polished PDF reports
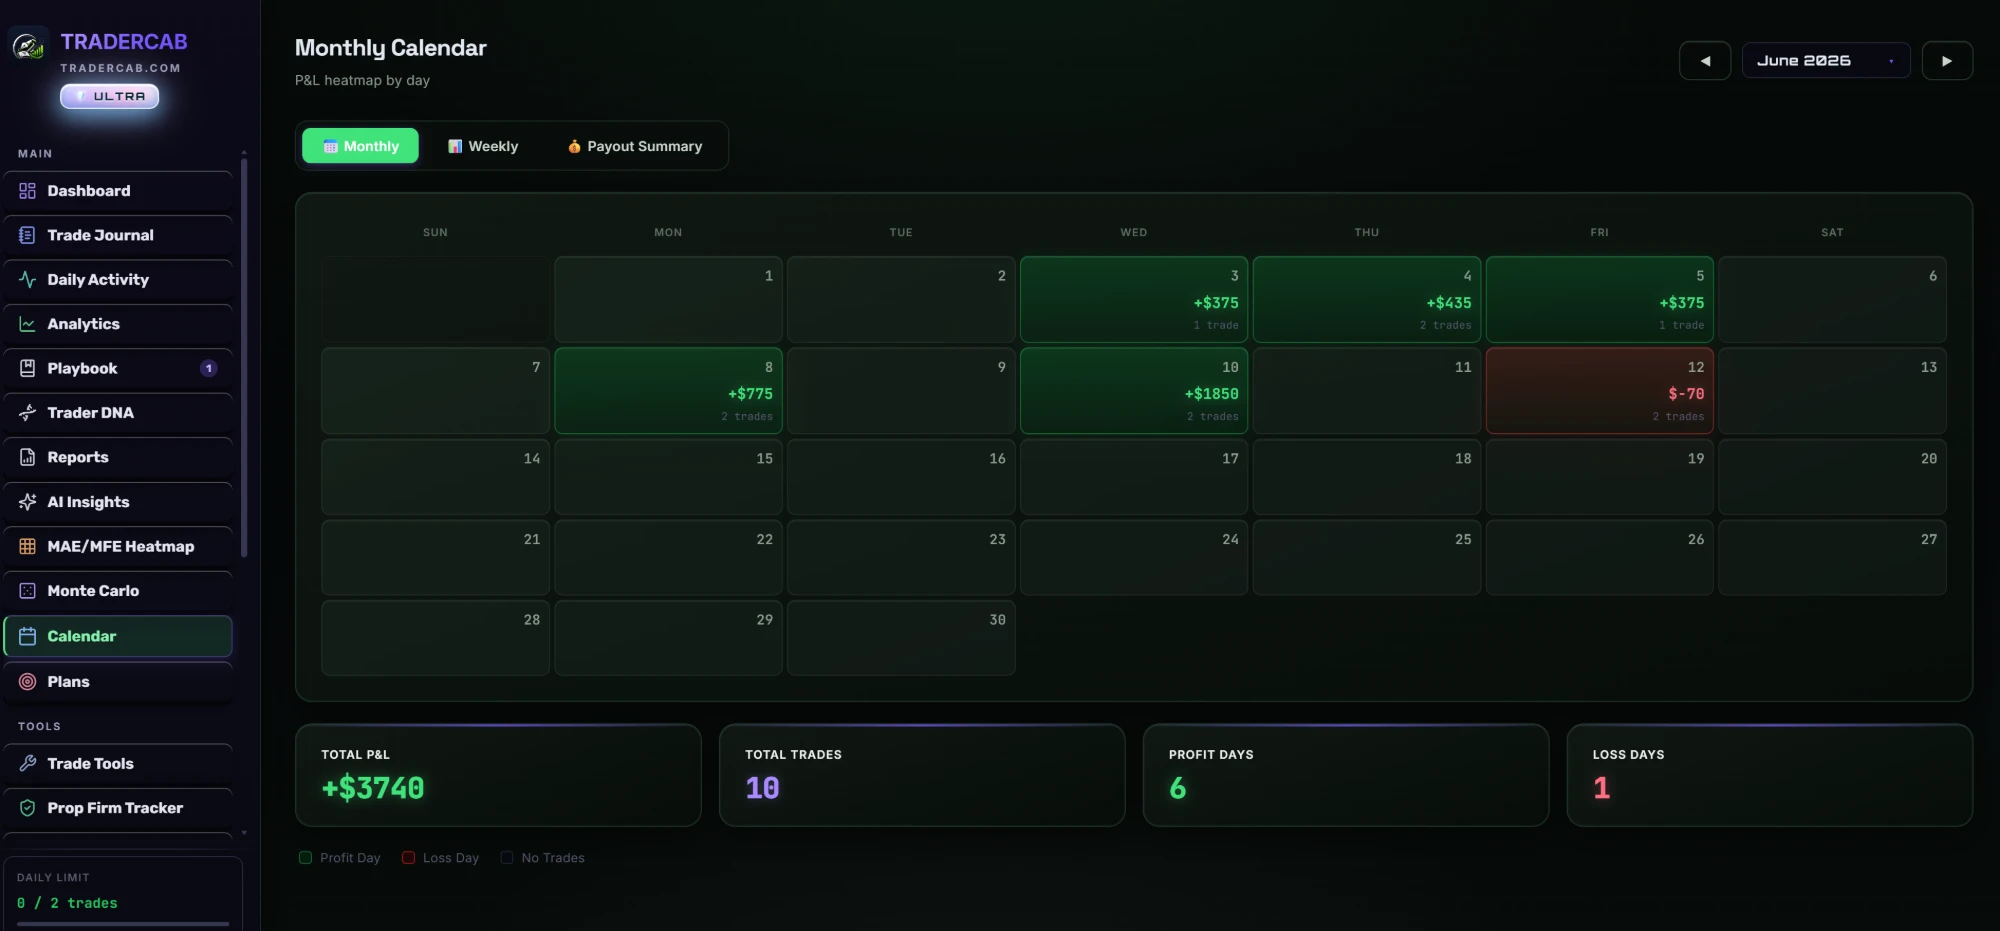
See your month at a glance
Every day color-coded by profit or loss — spot your hot streaks, your bad days, and the patterns that drive both. Click any day to drill into its trades.
- Daily & weekly P&L heatmap with monthly totals
- Click any day → that day's trades, mood & notes
- Win/loss streak tracking & consistency view
- Weekly Review templates to close out every week
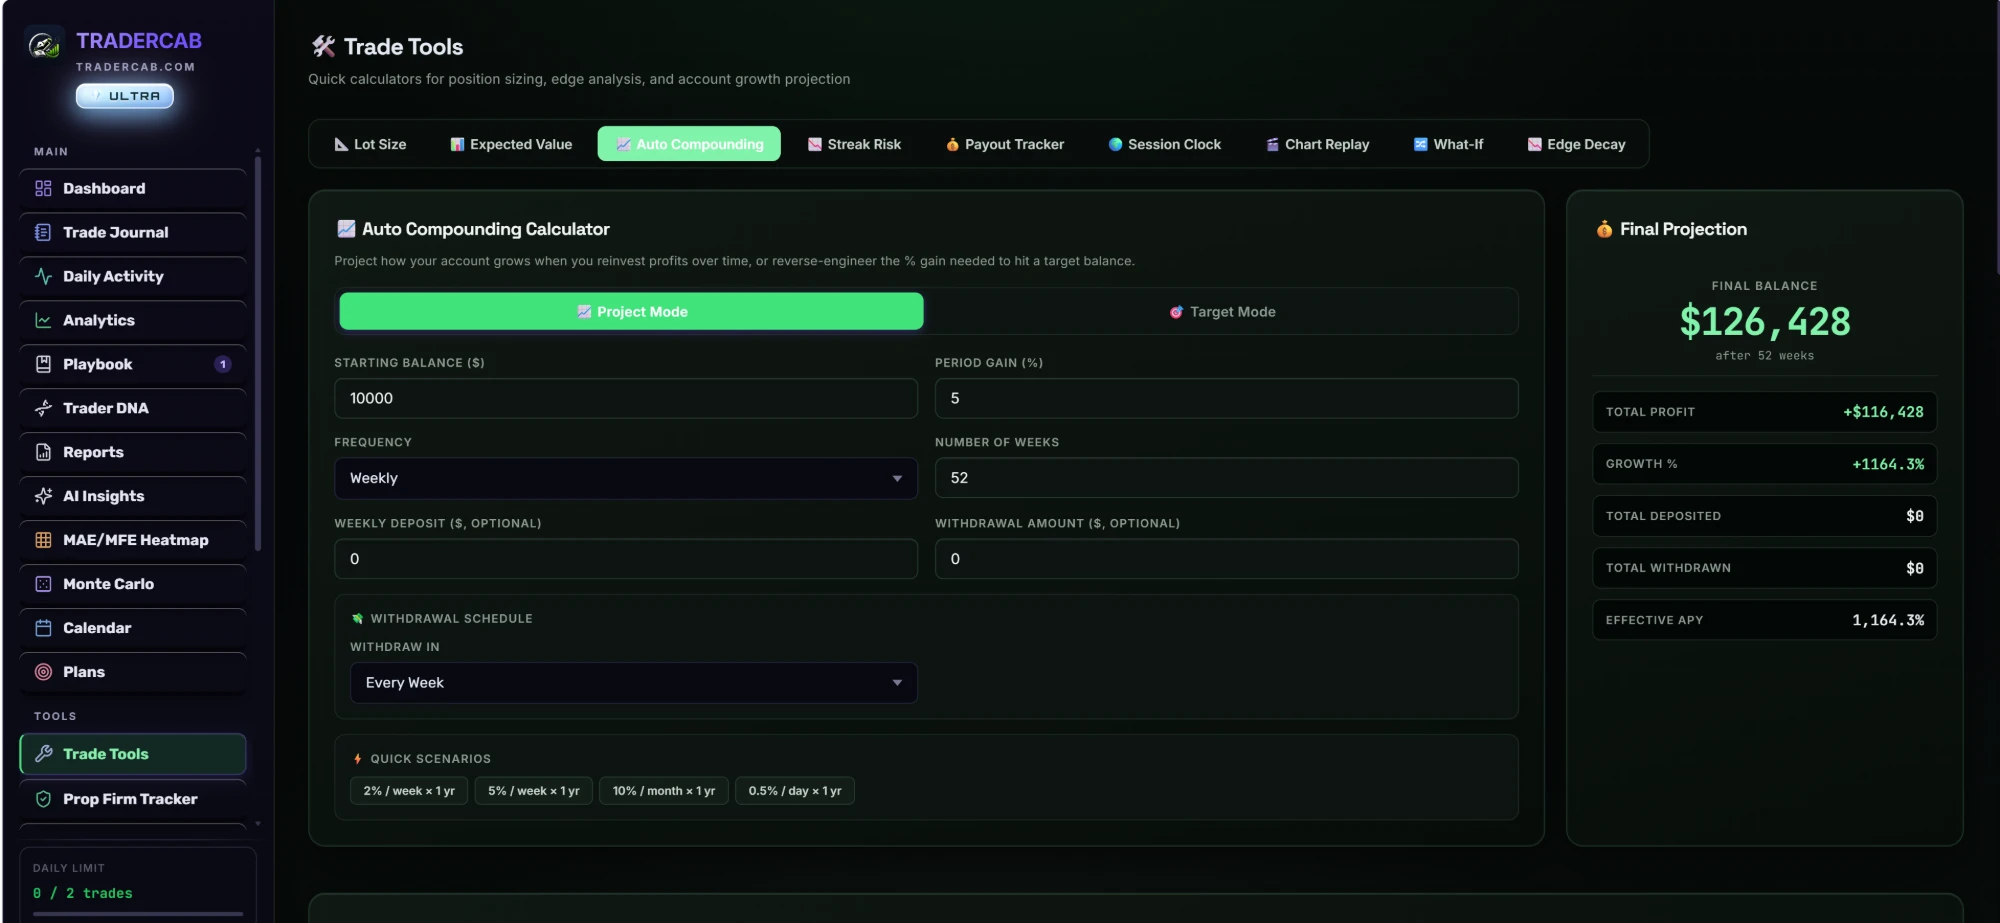
Size every trade right
Position sizing, risk calculators, a prop-firm drawdown tracker, recovery calculator, Monte Carlo simulator and backtest replay — all built in.
- Risk-based position size in one tap
- Prop-firm drawdown & profit-target tracker
- Recovery calculator — the honest path out of drawdown
- Monte Carlo simulation & backtest replay of your edge
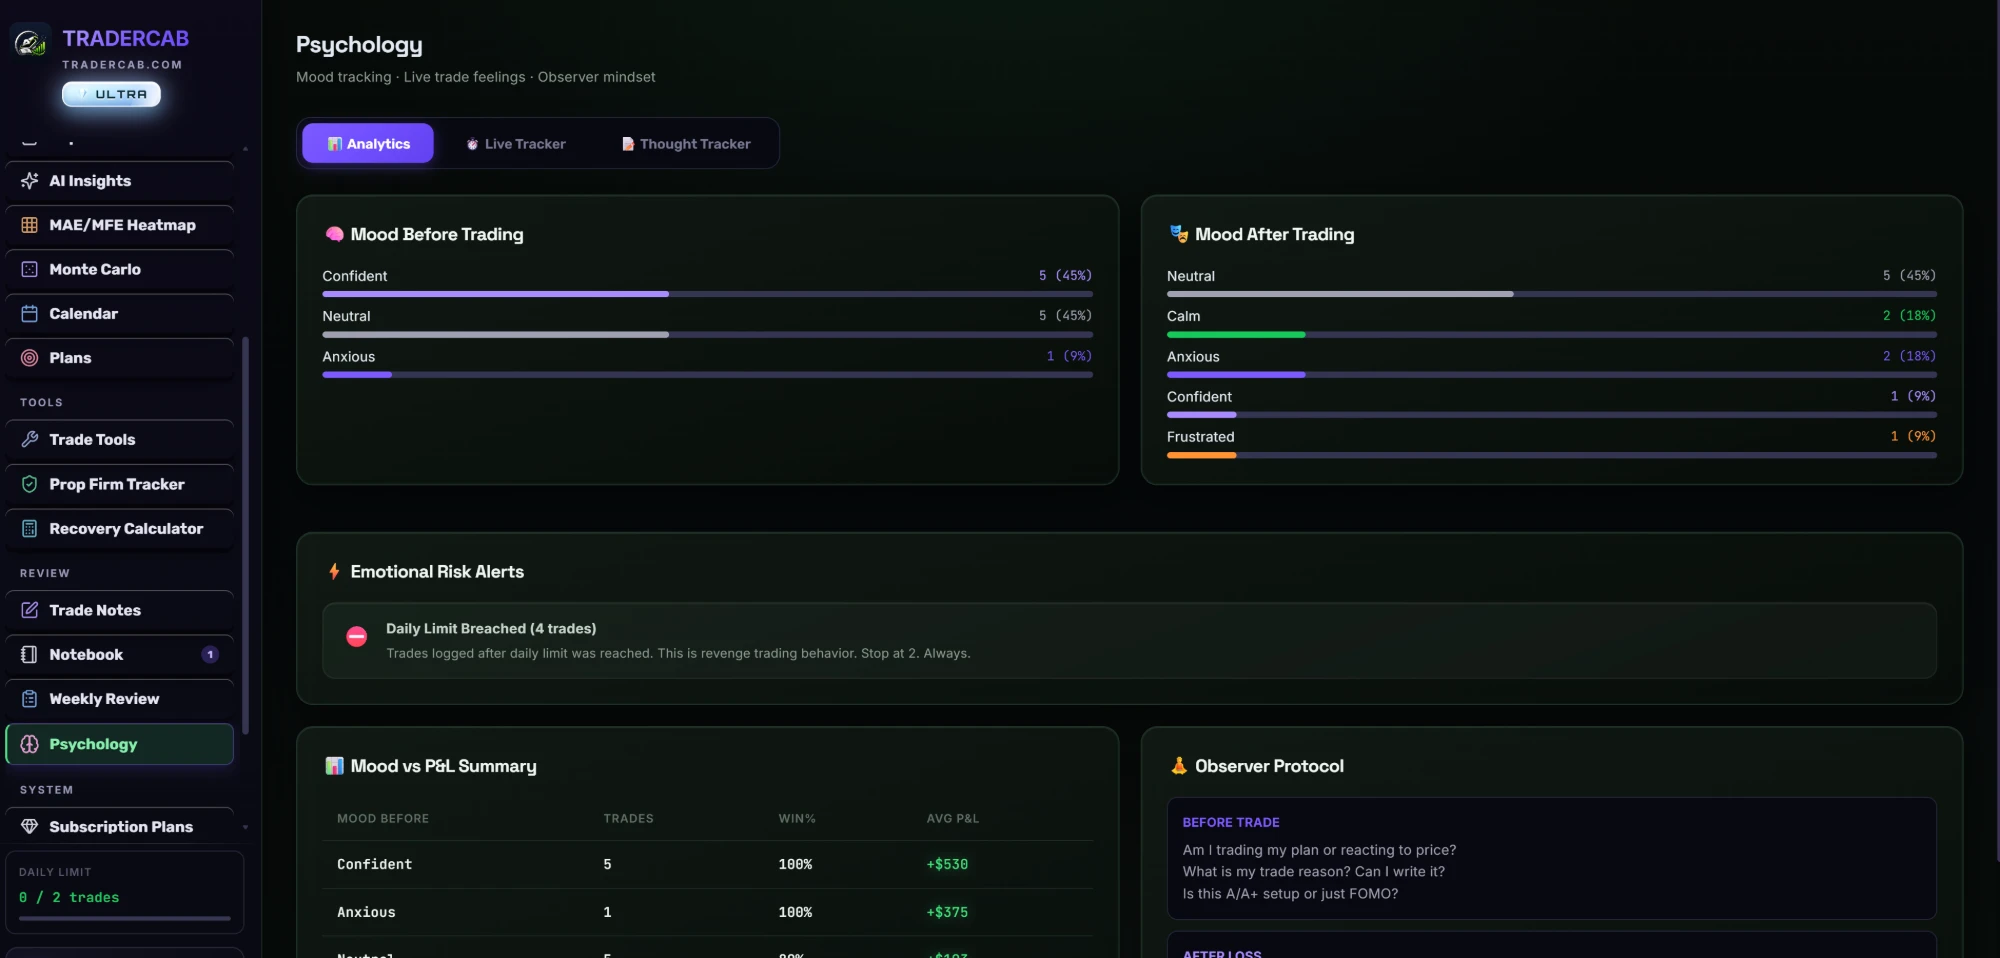
Master your mind, master the market
Track your emotion before and after every trade, keep a Thought-Emotion journal, and let Trader DNA + AI Insights surface the habits that cost you money.
- Mood before & after every trade — see which emotions win
- Thought-Emotion journal (day / week / month views)
- Trader DNA: six genes, an archetype & a score out of 100
- AI Insights: your leaks named in plain English, with the fix
From scattered notes to a real edge
- Trades buried in a messy spreadsheet
- No idea which setup actually makes money
- Emotions & mistakes never tracked
- Manual entry, hours wasted every week
- Every trade graded, tagged & analyzed
- AI Insights show your exact leaks & edges
- Psychology & discipline tracked automatically
- MT4/MT5 sync & CSV import — zero busywork
Everything a serious trader needs
Trader DNA
Your trading fingerprint — six genes, an archetype, and exactly which lever to pull next.
AI Insights
Deep auto-analysis surfaces your hidden leaks and real edges in plain English, with the fix.
Strategy Playbook
Build a strategy library with rules and per-setup analytics. Trade your plan, not your mood.
Notebook & Reviews
Rich notes, templates, weekly reviews and a full backup — your whole process in one place.
MT4 / MT5 Sync & Import
Auto-sync your broker, or import trade history from any platform via CSV. Zero manual entry.
Prop-Firm & Risk
Drawdown tracker, recovery calculator, position sizing and a Monte Carlo simulator.
See TraderCab in action
A quick walkthrough of the journal, analytics and discipline tools — tap play to watch.